 05-07-2016, 02:17 PM
|
|
|
<&(©¿©)&>
Industry Role:
Join Date: Jul 2002
Location: Chicago
Posts: 47,882
|
Quote:
Originally Posted by SuckOnThis

Oh and look who creates the most debt. 
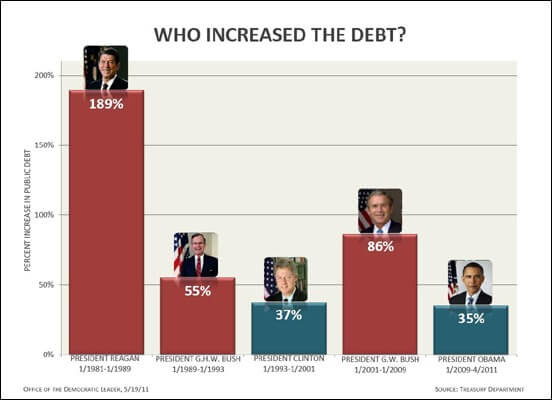 |
misleading charts don't change the fact that 10T of 20T debt were spent under Obama administration...
look at the stats straight from the white house:
https://www.whitehouse.gov/sites/def...s/hist07z1.xls
Table 7.1—FEDERAL DEBT AT THE END OF YEAR: 1940–2021
2001 5,769,881
2002 6,198,401
2003 6,760,014
2004 7,354,657
2005 7,905,300
2006 8,451,350
2007 8,950,744
2008 9,986,082 ~10 T
2009 11,875,851
2010 13,528,807
2011 14,764,222
2012 16,050,921
2013 16,719,434
2014 17,794,483
2015 18,120,106
2016 estimate 19,433,320
by the time Obama leaves office the debt will be around 20T... |

|


|